Joseph Afolayan
Data Analyst · Backend Engineer
I build backends. I analyze data. I solve problems.

Data Analyst · Backend Engineer
I build backends. I analyze data. I solve problems.
I'm a Backend Developer and Data Analyst with a background in Mathematical Science. I use Python to build practical solutions. I'm passionate about building reliable systems, solving real-world problems, and continuously expanding my skills in Backend Development, Data, Machine Learning, and AI.
 Python
 Flask
Flask
 FastAPI
 SQLAlchemy
 PostgreSQL
 SQLite
 Pandas
 NumPy
NumPy
 SQL
SQL
 Power BI
 Tableau
 Scikit-learn
 Docker
 Git
Git
 GitHub
 Redis
Redis
 Vercel


FastAPI service with Random Forest model predicting customer churn. Containerized with Docker.
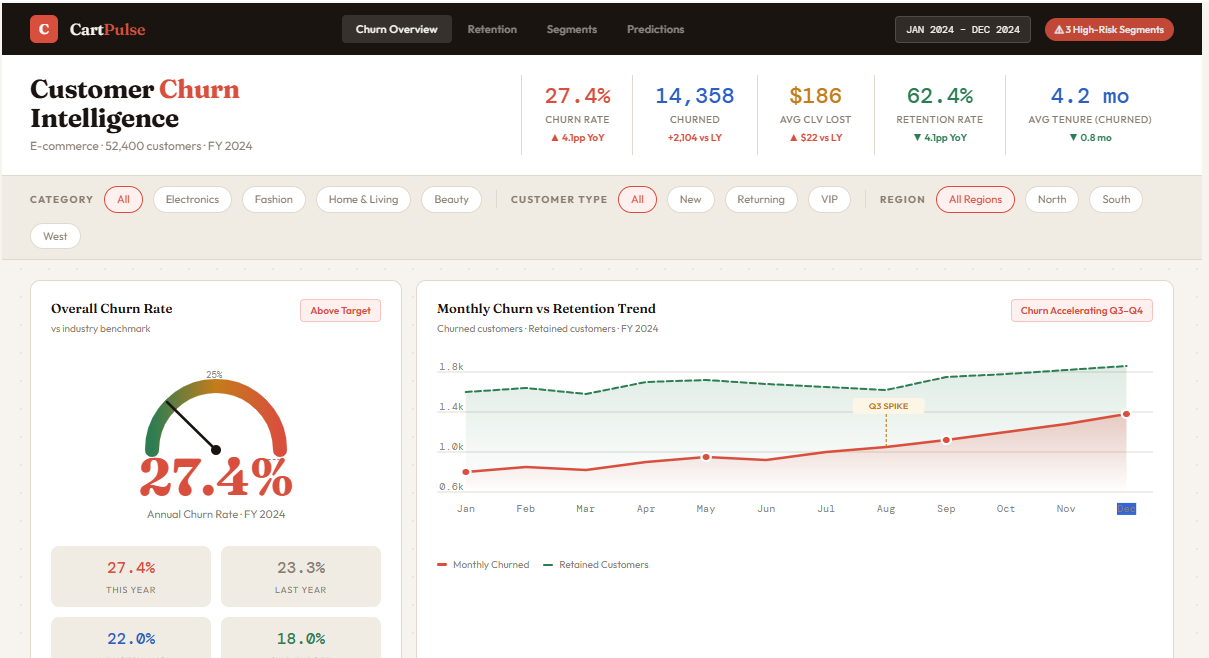
Power BI dashboard analyzing 52K+ customer records to identify churn drivers and recovery opportunities.
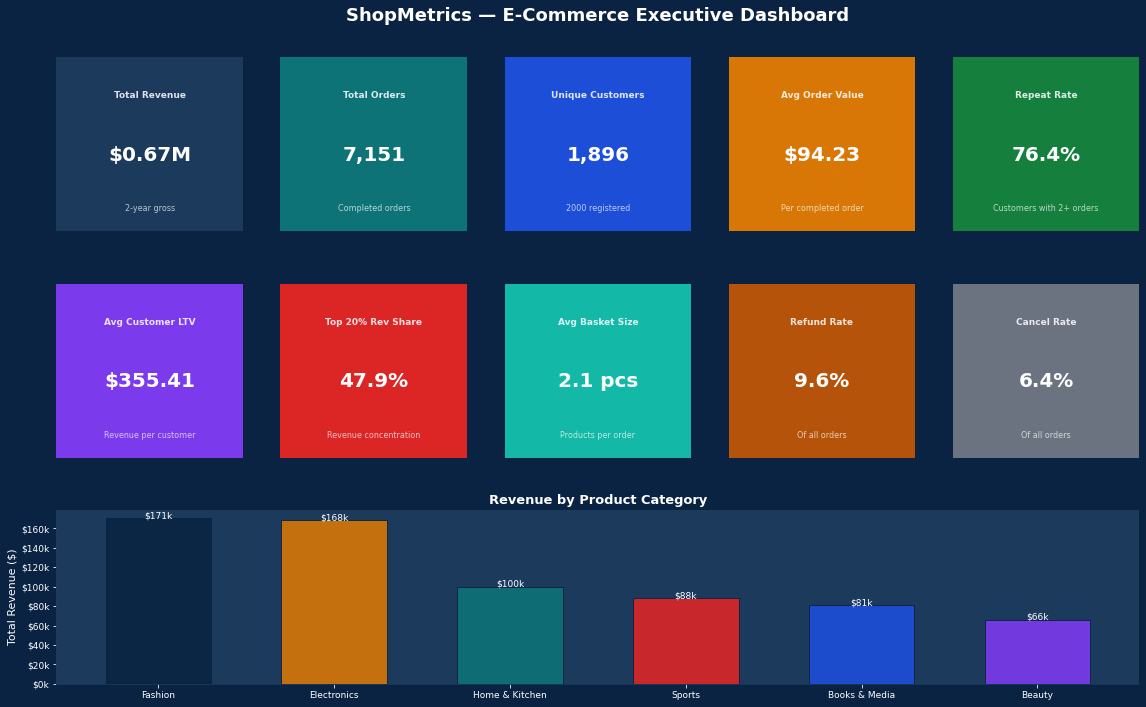
A full customer behaviour analysis for ShopMetrics with 2,000 customers and 8,500+ orders across two years.
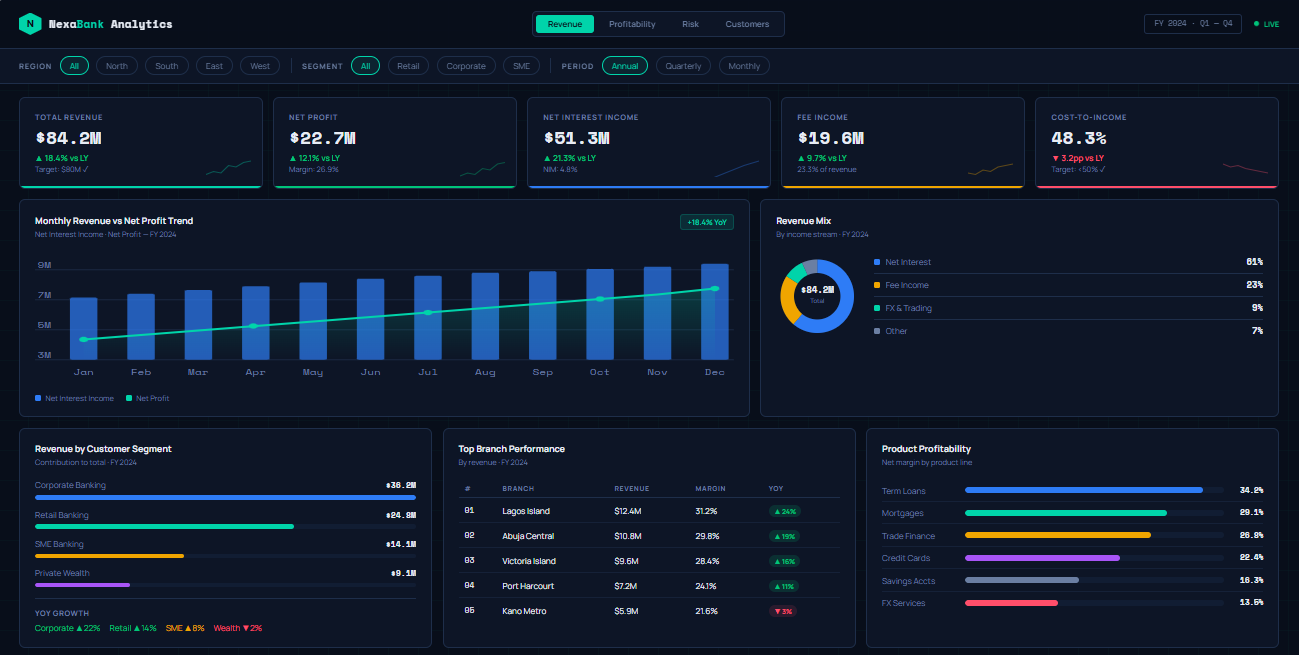
A comprehensive revenue analytics dashboard for a fictional mid-sized commercial bank tracking $84.2M in annual revenue across product lines, customer segments, and 5 regional branches.
Open to collaboration, Data Analysis, and Backend Engineering roles.
© 2026 Joseph Afolayan.